Transformer Engineering Blog
Sinusoidal Waveform: RMS, Peak and Frequency in Transformer Ratings
Read the time axis and voltage scale before using an AC waveform in a transformer specification.
A sinusoidal waveform varies smoothly through positive and negative values and repeats after one cycle. To interpret it, first identify the horizontal time scale and vertical voltage or current scale. Then locate two matching points one cycle apart.
For a zero-offset sine wave, the basic expression is v(t) = Vpeak × sin(2πft + φ). Vpeak sets amplitude, f sets frequency and φ sets the starting phase. Reading these fields correctly connects the graph to the equipment rating and measurement record.
Find period and frequency
The period T is the time for one complete cycle. Frequency f is cycles per second:
f = 1/T
| Frequency | Period in seconds | Period in milliseconds |
|---|---|---|
| 50 Hz | 0.020 | 20.00 ms |
| 60 Hz | 0.016667 | 16.67 ms |
For example, if a captured sine wave repeats from one rising zero crossing to the next after 20 ms, its frequency is 1/0.020 = 50 Hz. Measure between matching points. A positive peak to the next negative peak spans half a cycle.
OpenStax's AC sources chapter introduces the amplitude, frequency and time dependence of a sinusoidal AC source.
Separate RMS, peak and peak-to-peak
Peak voltage is the greatest excursion from the zero reference. Peak-to-peak voltage is the difference between the positive and negative peaks. RMS is the square root of the mean of the squared instantaneous values over a complete cycle.
For a pure sine wave with no DC offset:
Vrms = Vpeak/√2
Vpeak = Vrms × √2
Vpeak-to-peak = 2 × Vpeak
RMS provides a useful link to heating and power in a resistive load. A zero average voltage over the full cycle does not mean zero RMS voltage or zero heating.
| Label | What it describes | Keep with the value |
|---|---|---|
| Instantaneous voltage | Voltage at a particular time | Time reference and phase |
| Peak | Maximum excursion from zero | Polarity and waveform shape |
| Peak-to-peak | Positive-to-negative range | Full captured cycle |
| RMS | Effective value derived from squared samples | Measurement method and waveform conditions |
Work through a 120 V sine wave
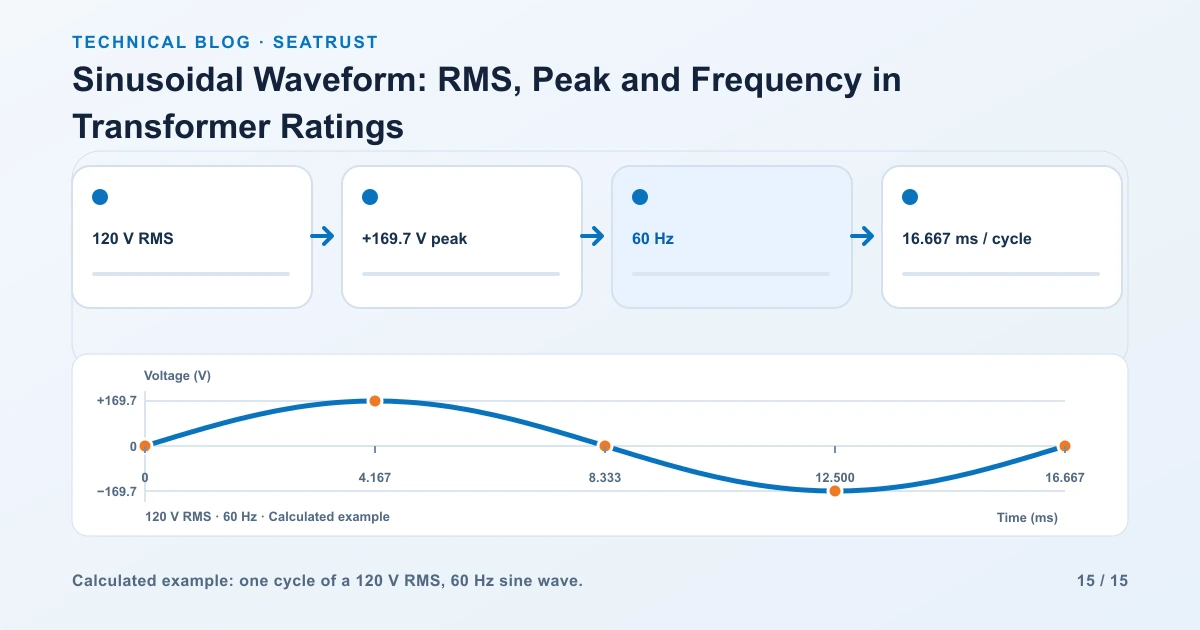
Use a calculated waveform with 120 V RMS and 60 Hz, starting at a rising zero crossing:
v(t) = 169.706 × sin(2π × 60 × t) volts
The peak is 120 × √2 = 169.706 V. The peak-to-peak value is 339.411 V. One cycle lasts 16.667 ms.
| Point in the cycle | Time | Calculated instantaneous voltage |
|---|---|---|
| Start | 0 ms | 0 V, rising |
| Quarter cycle | 4.167 ms | +169.7 V |
| Half cycle | 8.333 ms | 0 V, falling |
| Three-quarter cycle | 12.500 ms | −169.7 V |
| Full cycle | 16.667 ms | 0 V, rising |
These are calculated sample points for the stated sine wave. They provide a direct check on a diagram's axis labels and peak positions.
To compare 50 and 60 Hz visually, place both on the same 0–100 ms time axis with the same amplitude. The 50 Hz trace completes five cycles and the 60 Hz trace completes six. Keep separate trace labels as well as distinct line styles.
Read phase as a time relationship
When voltage and current traces share a frequency, the shift between matching points can be expressed as a phase angle:
Phase angle = 360° × time shift / period
At 60 Hz, a 2.778 ms shift is approximately 60 degrees because 360 × 2.778/16.667 ≈ 60. State which signal leads. For a lagging load, the current's matching feature occurs later than the voltage's.
Phase matters when calculating real power. The same RMS voltage and current can produce different real power when their phase relationship changes. The power triangle load guide applies that relationship to a load schedule.
Recognize when the sine-wave shortcut stops fitting
Flattened peaks, notches or a DC offset change the shape. With a distorted waveform, multiplying RMS by √2 does not generally recover the measured peak. Use an instrument and measurement method suitable for the waveform and retain the captured record.
For uniformly spaced samples over a complete representative interval, RMS can be calculated as √(sum of squared sample values / number of samples). Record whether an instrument reports AC-only RMS or includes a DC component, together with relevant bandwidth and sampling settings.
Use recorded traces to identify the actual waveform. A diagram calculated from a sine function belongs in a teaching example, while a project waveform should retain its instrument settings and measurement context.
Carry the useful fields into the transformer brief
| Field | What to record |
|---|---|
| Voltage | RMS value, operating range and measurement location |
| Three-phase convention | Line-to-line or line-to-neutral |
| Frequency | Nominal frequency and observed or specified range |
| Phase arrangement | Single-phase or three-phase supply and winding connection |
| Load condition | Equipment operating during capture |
| Waveform quality | Relevant harmonic or distortion information |
| Measurement context | Instrument, settings, date and equipment ID |
The AC transformer frequency guide explains how voltage and frequency affect the proposed equipment duty. Use volts versus amps when copying the measured quantities into a load schedule.
FAQ
Is the average of a sine wave its RMS value?
The ordinary average of a symmetric full-cycle sine wave is zero. RMS squares the values before averaging and taking the square root, producing a positive effective value.
Is a 120 V AC rating the peak?
AC supply ratings normally use RMS. For the zero-offset sine-wave example, 120 V RMS corresponds to approximately 169.7 V peak.
How many cycles are in 100 ms at 60 Hz?
Six cycles: 60 cycles per second multiplied by 0.1 second.
Can I compare two traces with different time scales?
First put them on a common time scale or calculate their periods. Comparing their shapes without reading the axes can hide a frequency difference.
Submit clear supply information
Provide the required RMS voltage, frequency, phase arrangement and relevant load or waveform records with the transformer enquiry.